
How to Measure In-Store Music Without Making Fake ROI Claims
A practical measurement framework for in-store music covering operational metrics, customer experience, experimentation, and responsible causal claims.
By
Ananya Iyer
Published
Oct 2, 2026
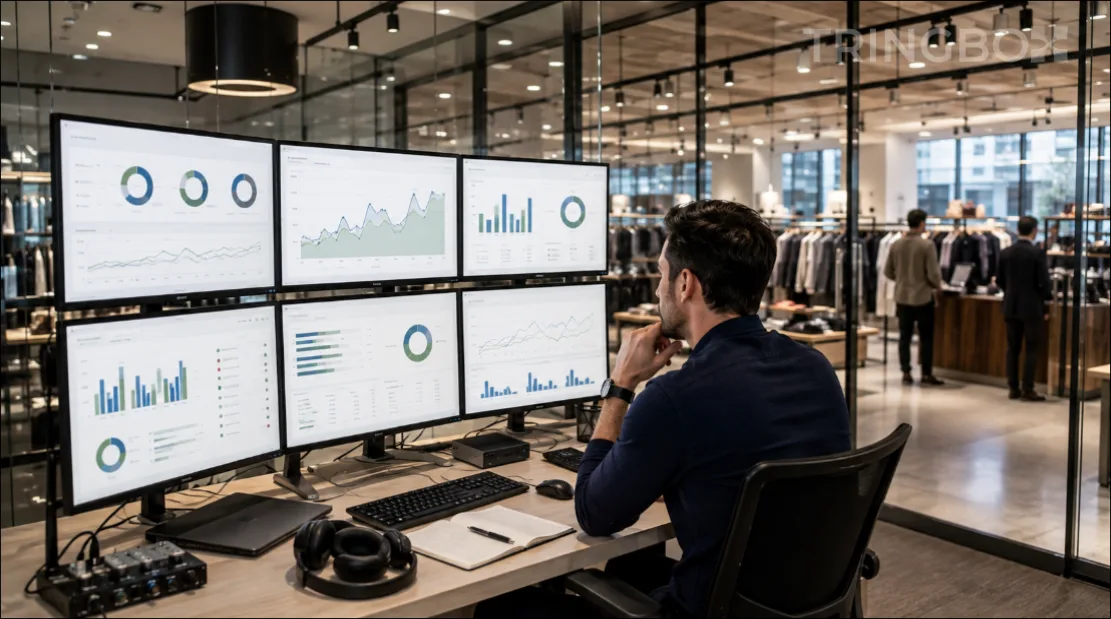
The absolute fastest way to destroy the credibility of a serious in-store music strategy is to march into a Chief Financial Officer's office and promise a precise, guaranteed sales increase without a valid experimental framework. Physical retail and hospitality spaces are incredibly complex, multi-variable ecosystems. Daily revenue is heavily influenced by footfall, flash promotions, staffing levels, visual merchandising, local weather, inventory availability, and broader economic pricing trends.
While background music absolutely contributes to the atmosphere and can shape consumer behavior, isolating its exact financial effect requires rigorous scientific care. When vendors jump straight to claiming that a specific playlist tempo 'releases dopamine and guarantees a 15% revenue bump,' they cross the line from evidence-based marketing into dangerous pseudoscience.
However, responsible measurement is still entirely possible—it simply needs to be structured in intelligent layers. You cannot measure a revenue increase if you cannot first prove the music actually played. In this comprehensive guide, we provide a practical, three-tiered framework to legitimately measure in-store music ROI, conduct valid physical retail experiments, and build a trustworthy executive scorecard using Tringbox AI.
1. Layer 1: Measure Whether the System Actually Works (Operational Metrics)
Key operational metrics include:
- Playback Uptime and Silent Minutes: The exact percentage of scheduled trading hours where audio successfully rendered through the speakers.
- Schedule Compliance: Whether the local player accurately executed the centrally mandated daypart transitions on time.
- Offline Incidents and Edge-Caching: Tracking how many hours the store lost internet but successfully masked the outage using local cached playback.
- Manual Overrides: Logging the frequency of staff pausing the music, skipping tracks, or adjusting the volume outside approved corporate boundaries.
- Proof-of-Play Completeness: Ensuring 100% of the playback history is securely logged for commercial licensing audits.
2. Layer 2: Measure Experience Quality and Brand Fit
- Structured Staff Surveys: Front-line employees hear the music for eight hours a day. Survey them on audio fatigue, track repetition, and their perceived stress levels.
- Customer Feedback and Complaints: Monitor Google Reviews and receipt surveys for explicit mentions of 'loud noise,' 'annoying music,' or 'relaxing atmosphere.'
- Music Appropriateness Ratings: Conduct periodic internal audits where regional managers rate the current daypart's acoustic congruence with the physical merchandising on a scale of 1 to 5.
3. Layer 3: Measure Business Behaviour Cautiously
4. How to Run Valid A/B Retail Experiments
5. Do Not Confuse Correlation With Causation
6. Building a Monthly Music Scorecard
- Playback Reliability: % of uptime and offline masking success.
- Policy Compliance: Number of unauthorized manual overrides or volume violations.
- Repetition and Coverage: % of the total approved catalog actively played, ensuring staff are not suffering from audio fatigue.
- Customer/Staff Experience: Qualitative feedback scores and complaint tracking.
- Business Metrics: Dwell time, table turnover, or conversion rates tied to specific A/B tests.
- Experiment Status: A log of active A/B tests and their current statistical confidence levels.
7. Frequently Asked Questions (FAQs)
A: No. Background music creates an overarching psychological atmosphere (priming) that influences general approach behavior and dwell time. It does not exert mind-control to force a specific SKU purchase. Measuring broad conversion rates and average transaction values (ATV) is much more realistic.
A: Human beings are notoriously terrible at self-reporting their subconscious psychological drivers. If asked, a customer will almost always attribute their purchase to the product's price or quality, completely ignoring the fact that the relaxed, congruent acoustic environment made them comfortable enough to stay in the store for 45 minutes.
A: No. Tringbox handles all music licensing completely for you. Your subscription includes full B2B commercial public performance rights, shielding your store from copyright audits, society fees, or individual registrations with PPL or IPRS.
A: Tringbox provides the exact, granular telemetry required for Layer 1 and Layer 2 measurement. Our central dashboard gives you real-time visibility into player uptime, exact proof-of-play logs, staff overrides, and catalog coverage, giving your operations team the clean data required to run valid business experiments.
A: In a commercial retail environment, an A/B test should typically run for a minimum of 4 to 6 weeks. This duration is necessary to smooth out weekly anomalies, account for varying weather patterns, and gather enough transaction volume to achieve statistical significance.
Conclusion
To measure in-store music ROI effectively, enterprise leaders must abandon the search for a magical, singular revenue metric and embrace a layered, operational reality. By proving that the hardware is highly reliable, the acoustic persona fits the brand perfectly, and the staff are free from audio fatigue, you immediately generate massive operational ROI. When you combine those foundational victories with carefully controlled behavioral experiments, you build an acoustic strategy anchored in truth, not hyperbole. With Tringbox AI, you gain the precise telemetry and centralized control necessary to transform background music from a subjective guessing game into a measurable, optimized pillar of your customer experience.
Never miss music licensing & industry updates
Add Tringbox as a preferred source to see our breakthrough guides, PPL/IPRS compliance updates, and acoustic trends first on Google Search & Discover.
Recommended for you
Best Song Request Apps for DJs in 2027: Which Tool Fits Your Gig?
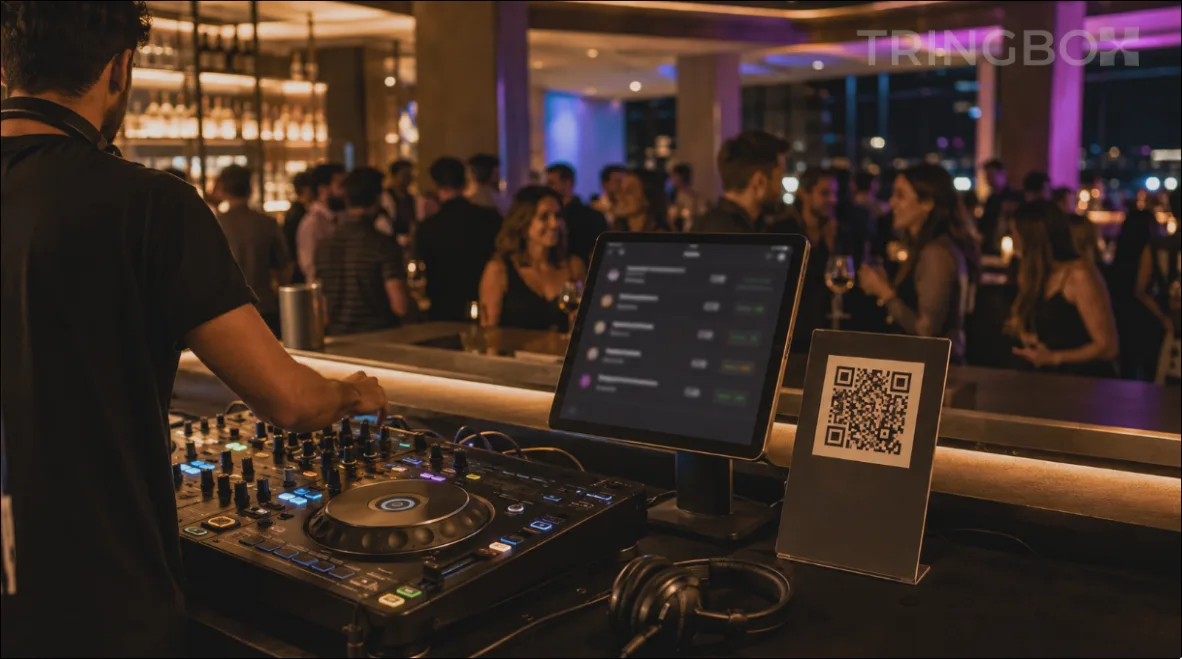
A great song request system solves a very specific operational headache: guests want to participate in the music, while the DJ needs to remain locked into reading the room, mixing tracks, and keeping the floor alive. Shouting over speaker stacks into the booth, scribbling names on cocktail napkins, thrusting sticky smartphone screens into the artist's face, or flooding direct messages on Instagram all disrupt the momentum of a live set.
Modern song request tools migrate that entire exchange onto a structured, frictionless digital channel. A guest simply scans a table or booth QR code or opens a short link on their mobile browser, types in an artist or title, and the request lands in the performer's digital queue without forcing an awkward conversation in the middle of a live transition or harmonic mix.
The request software category has matured dramatically. Instant QR entry and browser-based guest pages requiring zero app downloads have become baseline expectations. The true differentiators lie deeper: whether incoming tracks can be filtered against the DJ's banned list, whether performers have one-tap accept/reject controls, how digital tipping and paid priority requests are handled, whether the software integrates into existing DJ software and streaming libraries, and whether it scales from one-off mobile weddings to recurring multi-zone nightlife venues. In this comparative review, we break down the top song request platforms for DJs in 2027 and show where Tringbox fits into the live entertainment ecosystem.

Navratri 2026: The Spiritual, Cultural, and Commercial Ecosystem of India's Nine-Night Festival
Shardiya Navratri is not merely a religious observance; it is one of the most expansive, dynamic, and economically significant festivals in the global cultural calendar. Spanning nine nights and ten days, it represents the awakening of divine feminine energy (Shakti) and the ultimate triumph of cosmic order over chaos, symbolized by Goddess Durga's victory over the buffalo demon Mahishasura. However, beyond its profound theological roots, Navratri triggers a massive, synchronized shift across the Indian subcontinent. It alters daily diets, transforms public architecture, reshapes the retail economy, and rewrites the acoustic environment of every commercial and public space.
In 2026, Shardiya Navratri begins on Sunday, October 11, and concludes on Monday, October 19, followed immediately by Vijayadashami (Dussehra) on Tuesday, October 20. Because the lunar calendar governs the festival, the alignment of the tithis (lunar days) occasionally results in overlapping observances. In 2026, both Durga Ashtami (the eighth day) and Maha Navami (the ninth day) fall on October 19, creating a highly concentrated peak of devotion and retail footfall at the festival's climax.
Understanding Navratri requires a multi-dimensional approach. It is an intricate tapestry of ancient iconography, regional sociological practices, Ayurvedic seasonal science, and modern commercial strategy. For multi-location enterprise brands, navigating this period requires deep cultural intelligence. In this comprehensive guide, we deconstruct the nine forms of Navadurga, explore the physiological science behind the Navratri Vrat (fasting), examine how different Indian states manifest their devotion, and analyze how retail businesses must adapt their operations, supply chains, and in-store sensory marketing to serve a country in celebration.
Beyond the Generic Playlist: Architecting a Deepawali Music Strategy for Indian Retail
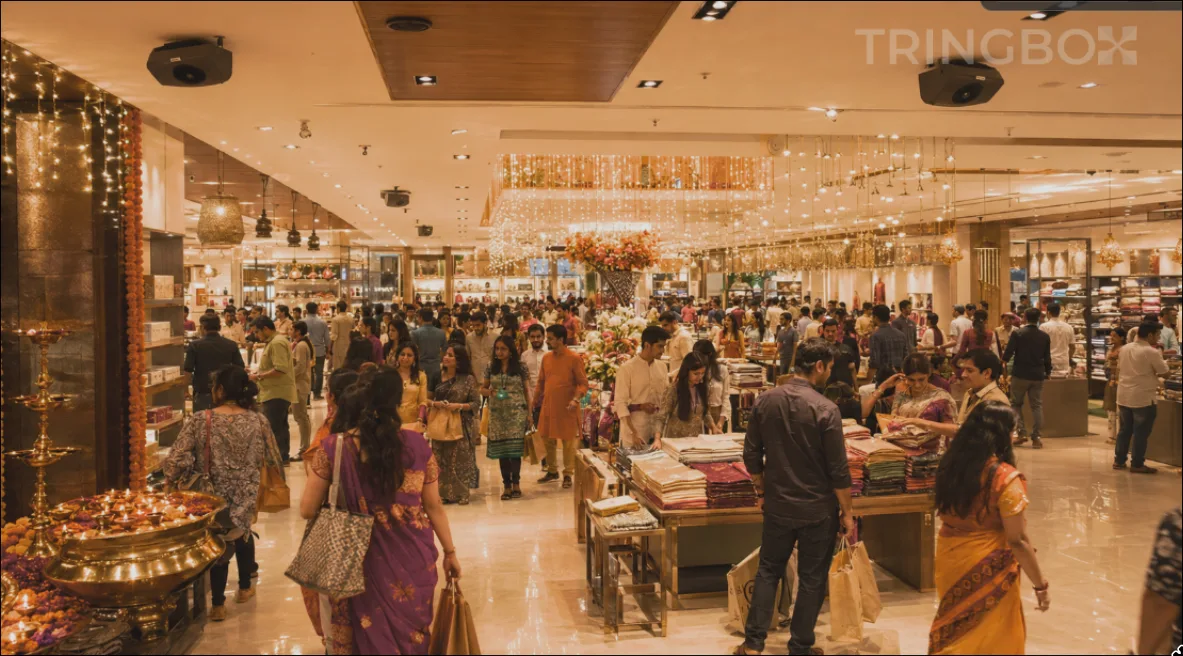
Deepawali is the undisputed apex of the Indian commercial calendar. For retail chains, hospitality groups, and automotive dealerships, the weeks leading up to Dhanteras and Diwali represent a massive concentration of annual revenue, unprecedented footfall, and high-stress operational intensity. In an attempt to capitalize on the festive mood, thousands of brands make the exact same critical operational error: they completely abandon their carefully curated acoustic identity and force their stores to play a generic, unmanaged 50-song 'Diwali Hits' playlist on a continuous loop.
This chaotic approach instantly dilutes the premium brand illusion, triggers severe audio fatigue among store staff working grueling 12-hour shifts, and completely ignores the complex physical realities of high-density crowd management. Deepawali should never be an excuse to abandon enterprise audio governance.
A truly effective festive music strategy requires treating the season not as an interruption, but as an intelligent, algorithmically managed audio overlay. In this comprehensive operational guide, we explore how to pace high-footfall crowds using tempo, how to match festive tracks to specific brand personas, and how Tringbox AI ensures your stores sound vibrant, legally compliant, and flawlessly on-brand throughout the entire Deepawali season.
The Future of Business Music: From Playlists to Context-Aware In-Store Media
The next generation of commercial business music will not be defined by who possesses the largest digital catalogue. In an era where cloud streaming has commoditized access to tens of millions of licensed tracks, raw library volume has become a baseline operational expectation rather than a competitive differentiator.
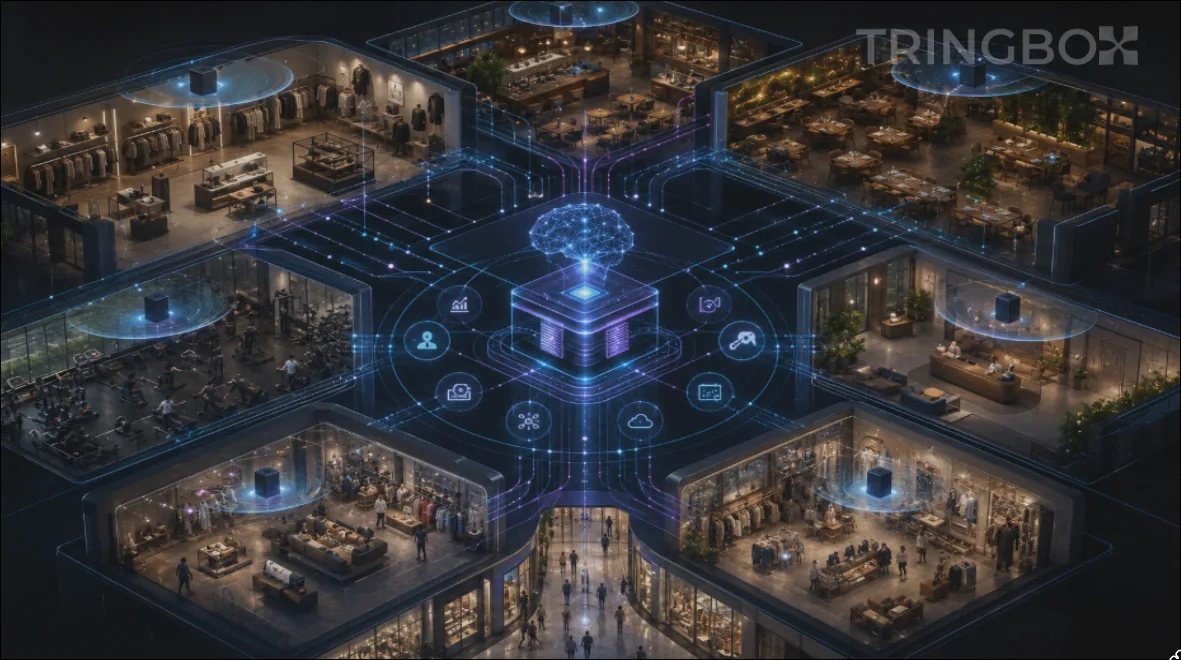
The true strategic frontier of physical commercial audio is shifting rapidly toward orchestration: how acoustic soundscapes intelligently adapt across brand personas, physical venues, operational dayparts, architectural sub-zones, promotional marketing campaigns, and real-time environmental context. Static, looped playlists pushed from a desktop folder are rapidly being rendered obsolete.
This structural transition is already unfolding across the global enterprise landscape. Leading industry commentary projects a deep, agentic convergence between machine-learning automation and expert human curation—transforming physical retail and hospitality spaces into fully unified experiential environments where background sound, promotional voice messaging, digital signage, and lighting work in seamless concert.
Commercial audio is shedding its legacy reputation as passive store decoration and emerging as an essential media operating system for physical real estate. In this forward-looking blueprint, we explore how business music is evolving into context-aware media, how artificial intelligence manages operational nuance at enterprise scale, and how Tringbox AI is defining the category of In-Store AI Music for modern multi-location brands.
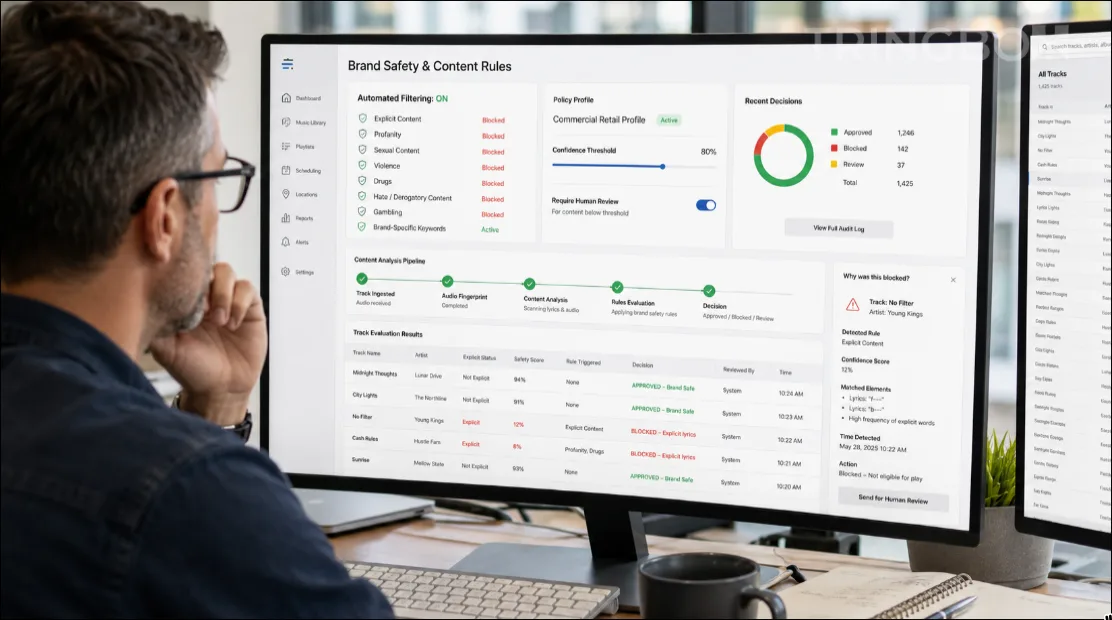
Brand-Safe Music Rules: How to Prevent Explicit, Inappropriate or Off-Brand Tracks
In commercial audio programming, an incredibly common and dangerous misconception is that “clean lyrics” automatically equate to “brand-safe music.” This is fundamentally false. A track can contain absolutely zero traditional profanity and still be wildly inappropriate for a family restaurant, a healthcare environment, a luxury retail store, or a corporate workplace.
A song about deep grief, graphic violence, political rebellion, or excessive drug use might pass a basic profanity filter while completely destroying the psychological comfort of your customers. For multi-location enterprises, brand safety cannot rely on a simple "Explicit/Clean" toggle on a consumer app. It requires a sophisticated, layered content policy that evaluates audio through a rigorous corporate lens.
Protecting your physical spaces requires a governance framework that understands context, nuance, and regional sensitivity. In this comprehensive operational guide, we dissect how to move beyond basic explicit-content filtering, how to govern sensitive themes, and how Tringbox AI ensures that every track played across your network mathematically aligns with your corporate risk tolerance.
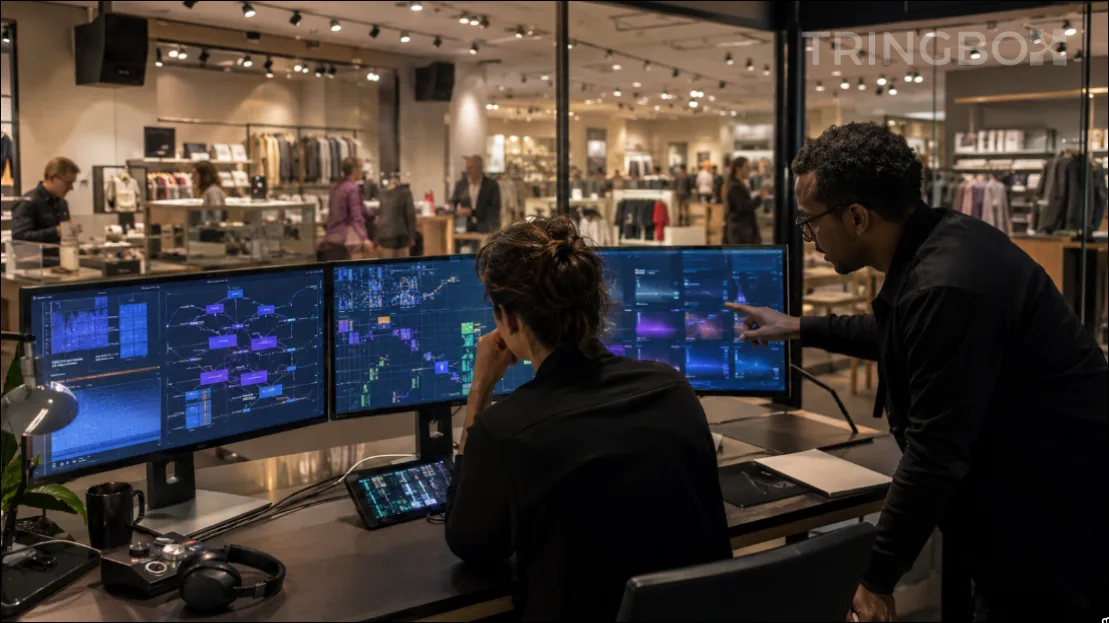
Explainable AI for Business Music: Why “The Algorithm Chose It” Is Not Enough
Artificial intelligence can effortlessly make thousands of complex music sequencing decisions across hundreds of store locations without a single moment of human intervention. However, in an enterprise corporate environment, mathematical scale is completely useless if the business cannot trust the boundaries of the system. When a regional operations manager calls headquarters to ask why a highly unusual or off-brand track played during the Friday evening rush, answering with “the algorithm chose it” is a fundamentally unacceptable operational response.
Modern commercial automation requires deep operational explanations. Store managers, brand directors, and legal teams need to understand the precise mechanical logic behind their acoustic environment. The solution to this 'black box' problem is a rapidly growing field of computer science known as Explainable AI (XAI).
In commercial audio, explainability transforms subjective musical curation from a mysterious digital magic trick into a highly auditable, governable business process. In this technical guide, we explore why enterprise brands require explainable AI, how to map algorithmic decisions to concrete business logic, and how Tringbox AI utilizes transparent decision pipelines to guarantee ultimate brand safety.
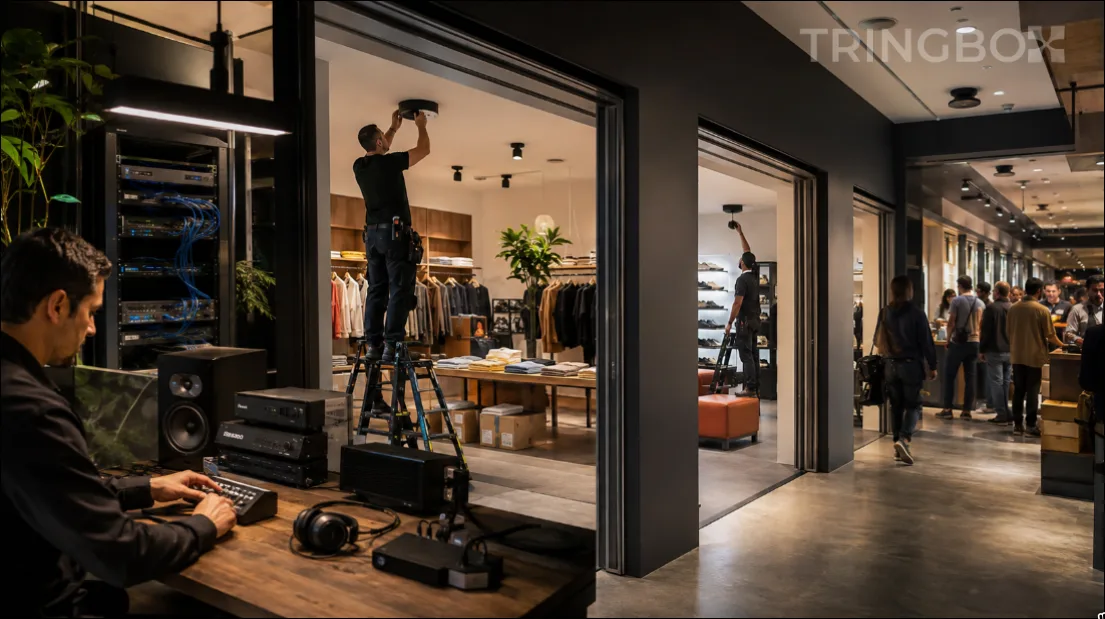
How to Migrate 100 Stores From Manual Playlists to Central Music Management
Replacing staff-managed playlists across a large multi-location store network is not primarily a software installation project. It is a massive change-management project involving complex brand rules, commercial licensing rights, hardware devices, local network stability, ingrained staff habits, and corporate IT support.
When enterprise retail and hospitality brands scale, the transition from local auxiliary cables to centralized cloud control becomes inevitable. The absolute safest, most effective migration path is a tightly controlled, phased rollout. In this practical operational guide, we provide a step-by-step roadmap for migrating your first 100 stores from chaotic manual playlists to a fully governed, AI-driven business music operating system.
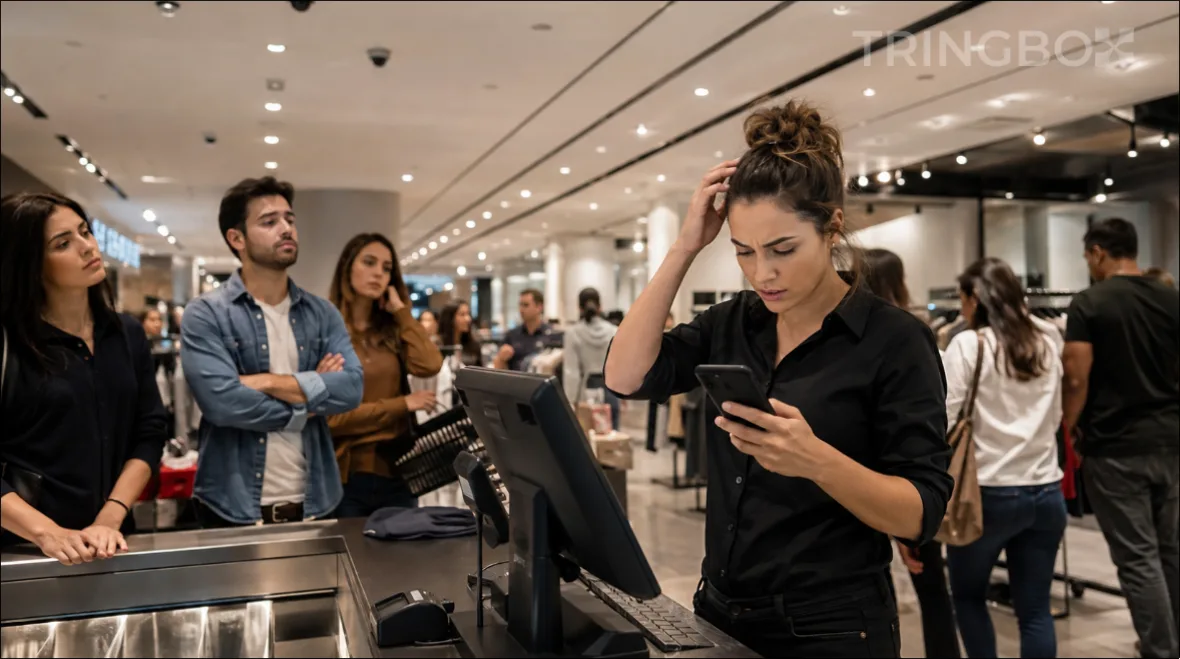
The Hidden Operating Cost of Employee-Managed Store Playlists
Letting store employees manage music feels incredibly inexpensive because the direct software cost on the monthly P&L is close to zero. The illusion is simple: a store manager plugs in their personal phone, opens a consumer app, and the store has music. However, the real cost of this setup is completely hidden, distributed across dozens of small, daily operational failures: time spent choosing music, inconsistent atmosphere, painfully repeated songs, inappropriate lyrical content, account login problems, severe copyright rights risk, and headquarters having absolutely zero visibility or control.
At one single location, these issues may feel mildly annoying but manageable. Across a scaling national chain of fifty or five hundred stores, they compound into massive operational friction and legal liability. In this analysis, we unpack the invisible labour, brand drift, and copyright risks of employee-managed playlists, and why centralizing music is an urgent operational requirement.
Why Spotify and Apple Music Are Not Business Music Systems
Spotify and Apple Music are undeniably extraordinary consumer products. They feature sleek, world-class user interfaces, host infinite music libraries spanning tens of millions of songs, and can be activated on any smartphone in a matter of seconds. That exact convenience is precisely why retail store clerks, cafe baristas, and restaurant supervisors instinctively plug their personal phones into the store amplifier whenever background music is required.
However, consumer streaming and enterprise business audio are two completely different use cases—both contractually and operationally. Paying for a personal Spotify Premium or Apple Music individual subscription does not give a business the legal or operational right to broadcast that audio across a commercial venue.
When multi-location enterprises rely on consumer apps, they expose their brand to catastrophic statutory copyright fines, destroy store-level governance, and subject their customers to unpredictable, off-brand playlists. In this comprehensive guide, we unpack the explicit legal terms governing consumer streaming in India, examine the operational vulnerabilities of personal apps, and demonstrate why dedicated platforms like Tringbox AI are essential for enterprise brand protection.
Commercial Music Licensing in India in 2026: A Practical Rights Map for Businesses
Commercial music licensing becomes confusing when businesses ask one broad question: “Is this song licensed?” A more useful approach is to ask which right, for which use, in which repertoire, and by whom. In 2026, that distinction is especially important because Phonographic Performance Limited (PPL India) was officially reinstated as a copyright society for sound recordings by the Government of India on 11 June 2026. PPL's current materials describe public-performance licensing for its represented sound-recording repertoire. Concurrently, IPRS publishes licensing information for musical works and accompanying literary works. This article serves as an operational overview for multi-location brands—not formal legal advice.